
It’s been a while. I took things a little slower over the summer here in the Northwest and spent some time in Iceland. I also found time to research observability for AI clusters, which is where the next few pieces are coming from.
Hundreds of billions of dollars are going into AI clusters and AI data centers, and hyperscalers and neoclouds account for most of it. They build mega-size GPU clusters — hundreds of thousands of GPUs per deployment, heading toward a million — to meet today’s demand and to position for the demand they expect. The enterprise builds at a very different scale: 128 to 256 GPUs is the sweet spot, a significant difference from the other two markets.
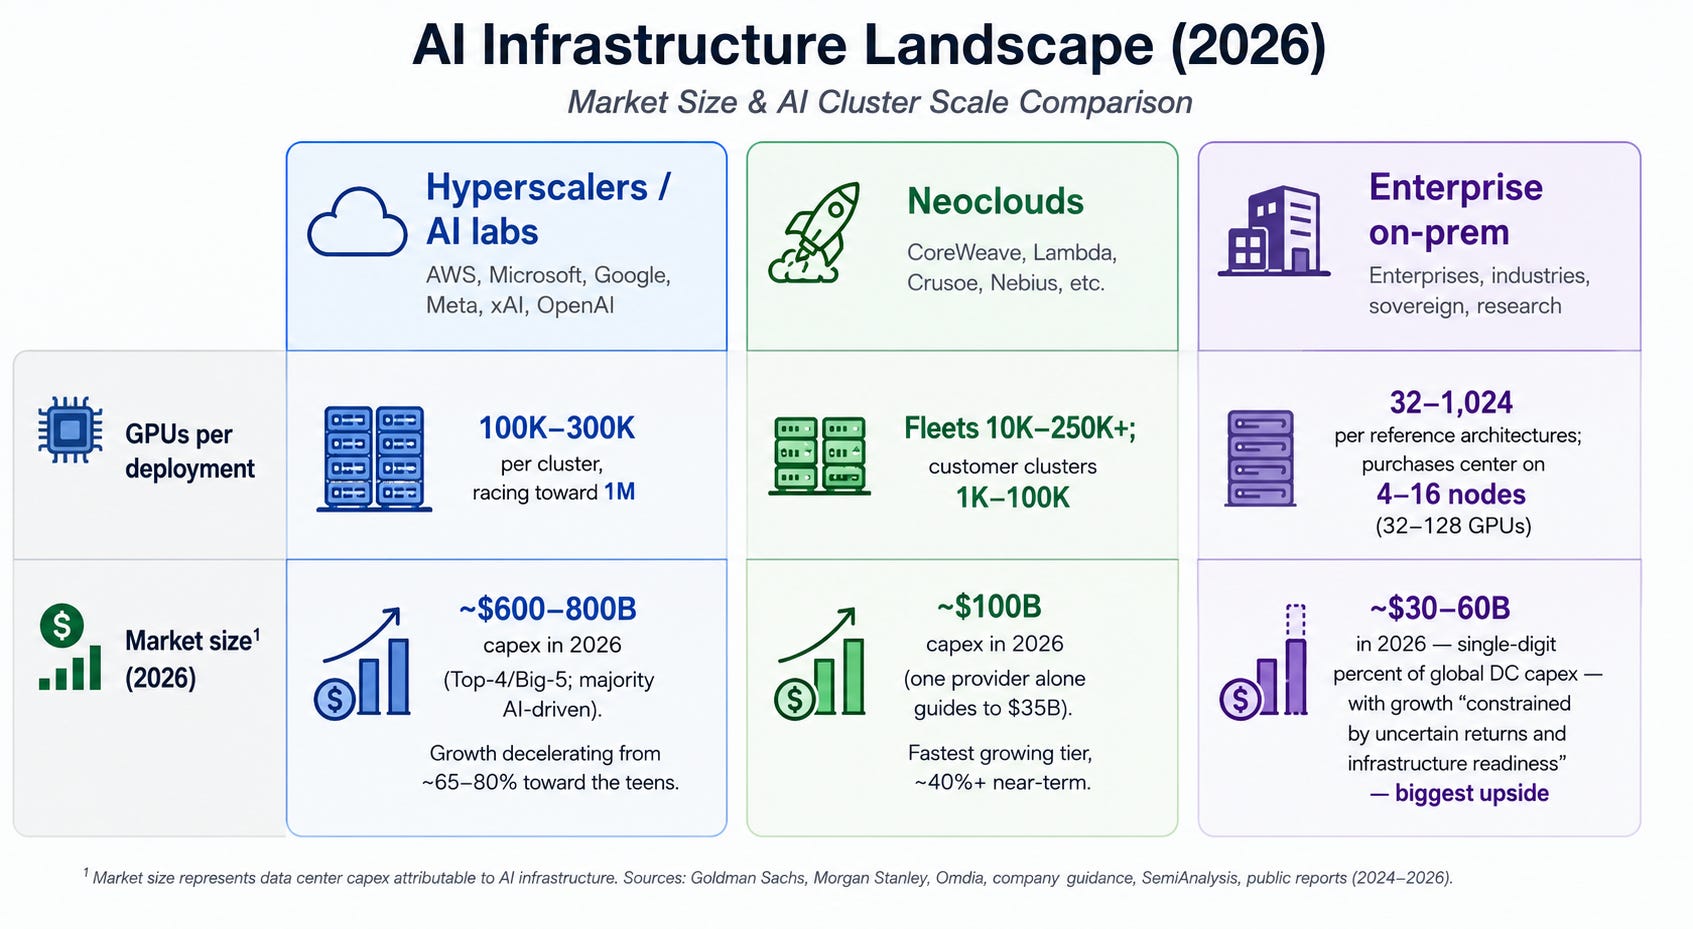
Enterprises are, for the most part, in a wait-and-see posture. They’re spending to make their infrastructure AI-ready, but most are holding the larger commitment — building and operating AI clusters in their own data centers — until they understand the actual needs and economics well enough to justify the capital.
An enterprise builds that cluster to serve the business through inference — to return decisions, answers, and actions reliably, consistently, at low latency, and efficiently. It weighs the choice across several dimensions, and on most of them it gains a real advantage by running the cluster in its own data center.
Open-weight models are catching up to frontier models. That lets the enterprise run a smaller model tuned to its own business instead of paying for a general-purpose frontier model on every request. A specialized model spends less compute per answer, so each answer can cost the enterprise less than routing the same work through a full frontier model. As Ben Lorica argues in his recent analysis, open-weights models can sharply cut the unit cost of repeatable work — document processing, classification, extraction, internal search, customer support, summarization. The savings aren’t automatic, as we’ll discuss later.
Model stability is another compelling reason to run and control the model in the enterprise’s own data center. An enterprise that holds the weights can pin the model version and guarantee consistent behavior, which can be critical in regulated, high-stakes environments. A hosted provider might update or retire a model for its own reasons, even when it commits to notify the enterprise ahead of time.
When the enterprise places the cluster next to its data and its users, it improves latency. It holds not just the median but the tail — P95 and P99, not only P90 — and meets low-latency demands that centralized capacity struggles to hold across every location. Amazon found that every 100ms of latency cost 1% of sales; an agentic workflow that chains five or ten inference calls compounds latency at every hop, so the tail matters more, not less.
An enterprise that keeps the model inside its own perimeter gains a stronger security posture and data sovereignty. It avoids the multi-tenant exposure where researchers keep finding ways to break isolation between neighbors, and it keeps its data under its own control by default. Data sovereignty is an inherent property of where the cluster runs, not a feature bolted on afterward.
None of these advantages is absolute, and this is not an exhaustive list. Hyperscalers and neoclouds work continuously to answer each one — sovereign regions and partitions for data control, edge and local zones for latency, dedicated tenancy for isolation — and they close part of the gap with each release. The enterprise weighs each dimension against a provider that keeps improving its technical answer to it.
The cost of owning
The use case has to deliver a positive ROI, and the advantages have to hold up against the option of renting the capacity. On cost, the provider holds a structural advantage: scale, and large in-house teams that run clusters efficiently with observability tooling built to drive down the mean time to resolution of failures. The enterprise makes a fixed-cost investment instead. It pays for the GPUs whether they run productive work or sit idle, so to break even against renting, it has to keep the cluster busy — utilization in the neighborhood of 70%.
In practice, enterprises run far below that. Cast AI’s 2026 report, drawn from telemetry across tens of thousands of Kubernetes clusters, found average GPU utilization around 5%. ClearML’s survey found only 7% of organizations exceed 85% peak utilization, with enterprise figures commonly in the 10 to 30% range. Once the enterprise counts depreciation, software licensing, support, power, facilities, and staff, its cluster carries a fully loaded cost of $5 to $7 per provisioned GPU-hour, depending mostly on the depreciation term it applies. For a 128-GPU cluster, the difference between running at 30% and running at 70% comes to $6,000 to $8,600 a day — $2.2M to $3.1M a year — in capacity the enterprise paid for and never used, and the figure scales with the size of the cluster. Cost per productive GPU-hour is the provisioned cost divided by utilization: the less the cluster produces, the more each answer costs.
Utilization comes down to time to resolution
To keep utilization high, the team has to maintain a low MTTR. In a system this complex, configuration drift, software upgrades, and unforeseen failures are unavoidable, and the ones that cost the most are gray failures: every component reports healthy while the service degrades and the P95 latency goes sideways. Detecting that something is wrong is easy. Root-causing these issues is hard, as operators of complex infrastructure know well, and packet data is often the best and only way to understand what happened.
Modern AI fabrics carry rich telemetry: each switch, GPU, NIC, and storage system reports its own condition, streamed over open standards. That intra-component telemetry is necessary, but sometimes it isn’t sufficient. Packet data shows the communication between components and lets the operator see which components are out of sync. Component logs, configuration, and metrics are what the operator needs to decide how to fix the issue.
Two examples help demonstrate this type of failure. In the first, an inference service answers unevenly — a median time-to-first-token of 200ms, but a P95 of 1.2 seconds — while the GPUs, CPUs, NICs, and switches all report normal. The key to root-causing the issue comes from packet data, an oscillating pattern of zero windows from the clients. The reason for the uneven behavior is that the inference process holds the Python interpreter lock while it tokenizes, can’t read from its sockets during that window, and stalls its own senders. The bottleneck is CPU scheduling in the pods, not bandwidth, and the fix is configuration. In the second, a training job’s GPUs drop to zero for about 27 seconds every 45 minutes, and the team writes it off as normal variance. Correlated packet timestamps across observation points explain it: storage round-trip time climbs from 50 to 800 microseconds in a window that lines up, to the millisecond, with the gap in collective traffic on the GPU fabric — a synchronous checkpoint stall, every worker writing at once, which staggering the writes recovers.
As we saw, an enterprise has many compelling reasons to operate its own AI cluster: it can run tailored models, control them fully, guarantee its own data sovereignty, and hold latency low. But an AI cluster is a complex system, and it will experience gray failures. Reducing the MTTR of these failures is the key to moving from 30-40% utilization into the 70-80% range, and that is what makes the economics of owning the cluster work against renting from AI service providers. And as the examples show, in many cases packet data is the difference between days of trying to root-cause an issue and minutes. In a follow-up, I’ll go deeper into the technical details of observability in AI clusters using packet data.
This article is part of the “Packets and Perspective” series exploring how packet observability intersects with the challenges facing modern IT operations and security teams.